Add logs in Xcode without rebuild
I am an iOS developer developing the best-rated banking app in Germany from before it went beta 🇩🇪 I focus on all the aspects of software engineering, from writing good code to developing scalable architectures to enhancing UX and other not-so-much-code-related things. I also put a lot of attention to establishing communication flows and creating a great atmosphere. One of my other focuses is providing a constant flow of cats and memes all over the place. I think in this part I succeeded the most.
In this article, I'll show how to add logs for iOS app without rebuilding. If you want to skip to the main part just jump to the "Adding logs without rebuild" section.
Short intro
There are three main ways to find bugs in the app: debugging by guessing, using debugger, and using log statements.
The first one, debugging by guessing, is a funny way to waste time. One changes something in the code and runs it over and over hoping that the issue has now been resolved. Usually, that method only brings more bugs and pain. It's practiced by very inexperienced or very tired programmers.

The contrary to that is the most analytical approach, using the debugger. We are not blindly changing the code but we rather analyse how and why we got in a certain state. This method reduces compile-run cycles, mostly we can spot the issue within one run.
But sometimes it does not work. Either the issue happens only once in a while, or it involves some race condition where the breakpoint would be too much effort, or it needs some prior state that is also not that easy to reproduce. Oftentimes, I fall back to adding logs to see what's going on.
Debugging with logs looks so:
Spot a bug
Add print logs
Restart the app
Realise that more logs are needed and go back to point 2
Adding log statements without rebuild
But there is no need to rebuild the app and even modify the source code to add those print statements! We can do it with breakpoints.
A step-by-step instruction:
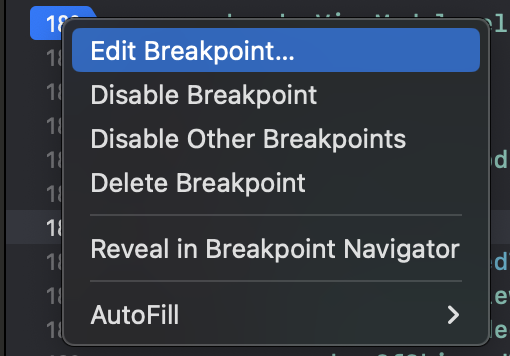
Create a breakpoint where you want to print something
Right-click the breakpoint -> click Edit
- Tap
Add Action
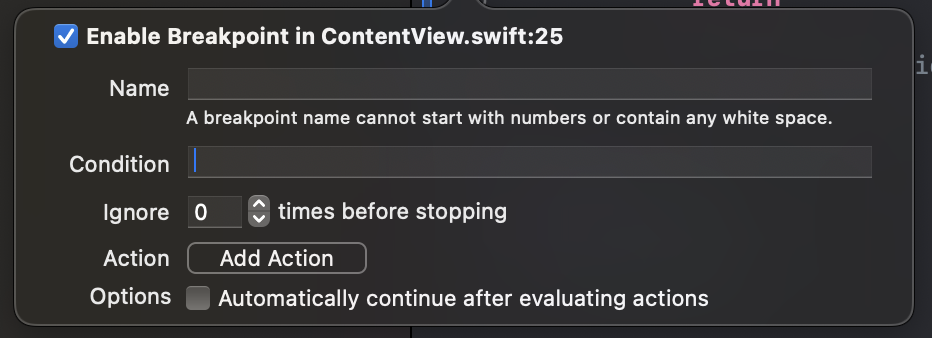
Choose
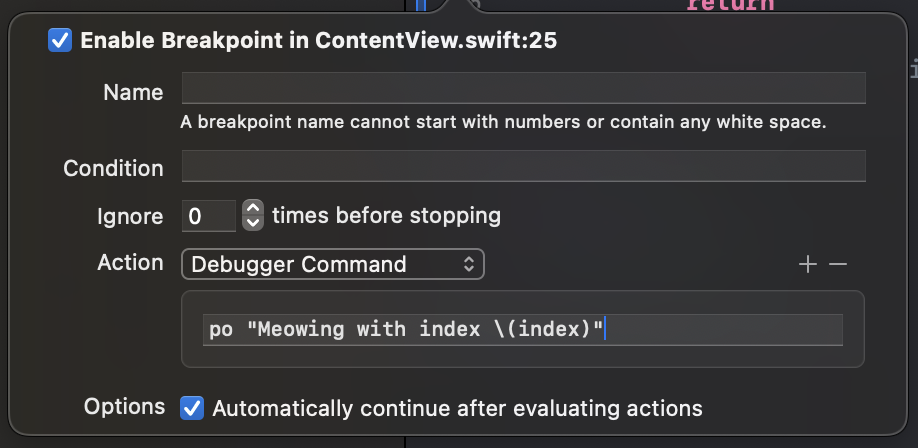
Debugger CommandIn the command line, log what you want. For example, you can add
po "xxx \(index)"whereindexis a local variable
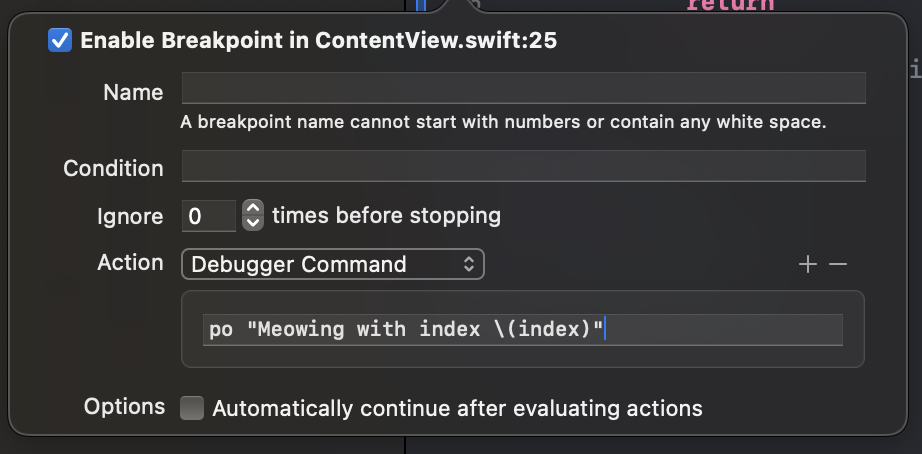
- Tada 🎉 now each time the breakpoint is activated console will output "Meowing with index <index-number>". One downside – execution stops on the breakpoint. To mitigate that, there is this magic "Automatically continue after evaluating actions" checkmark
And now we are done! One note to consider. When the breakpoint is hit for the first time I usually experience a 1-2 seconds lag.
Additional tricks
Replacing variable values
With the LLDB magic, we can also modify the data to see how it is displayed or how our function performs. Let's assume there is such a piece of code.
header.text = makeHeaderTitleString(someObjectFromBE: .init(title: "meow", subtitle: ""))

...

func makeHeaderTitle() -> String {
    var resultText = someObjectFromBE.title
    resultText += someObjectFromBE.subtitle
    return resultText
}
If BE is not ready or we are too lazy to stub it with tools like Charles, we can simply put a breakpoint on the line resultText += someObjectFromBE.subtitle with an instruction to replace the value:
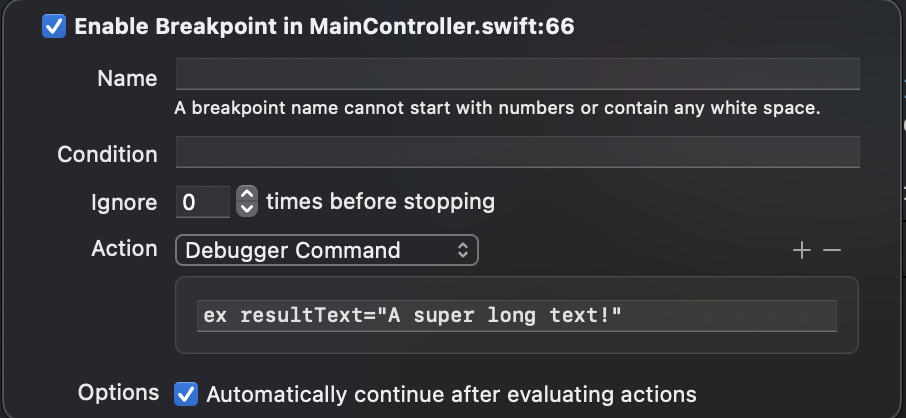
The variable will get changed and our debug console will show exactly what we want it to show.

Of course, there are many limitations and concerns. The three most common ones are:
It only works for variables
SwiftUI allows testing the output directly in the preview
We should validate behaviour of most of the functions in unit tests because then those checks persist and serve as documentation forever.
But sometimes I still find it useful to just have a quick check in the running app.
Making Xcode speak
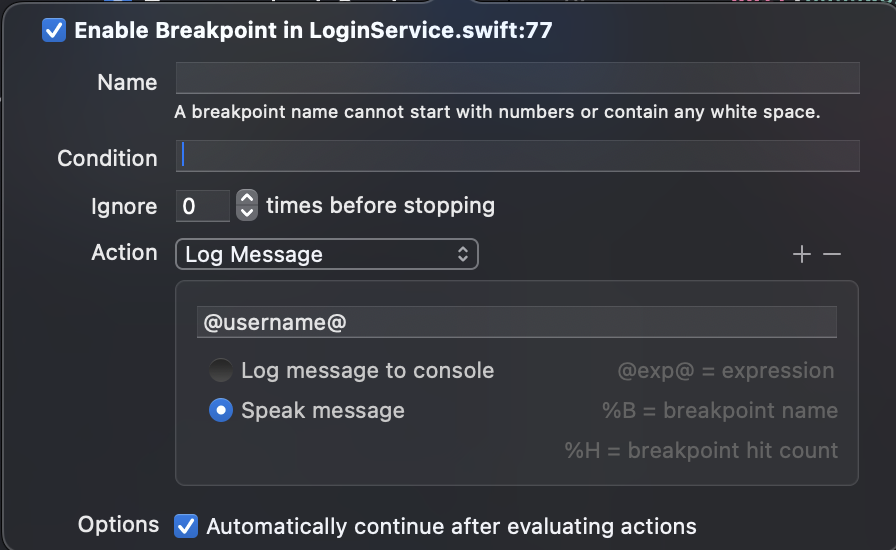
Isn't it nice when someone reads things out loud to you? You can save a lot of energy! And making Xcode talk is not hard. In the same Edit Breakpoint menu instead of Debugger Command we can use Log Message option. A breakpoint set up as the one on the picture below will read username each time when the breakpoint is hit.
The better use case would be speak out the exceptions. For example, I have such a function through which all the exceptions in the app are logged. Getting notified with voice is useful because I am not constantly checking the console.
public static func exception(_ message: String, tag: String) {
    log(message: message, tag: tag, level: .exception)
}
Persistence of breakpoints
Do you like swiping all the breakpoints to the side as strong as I do?

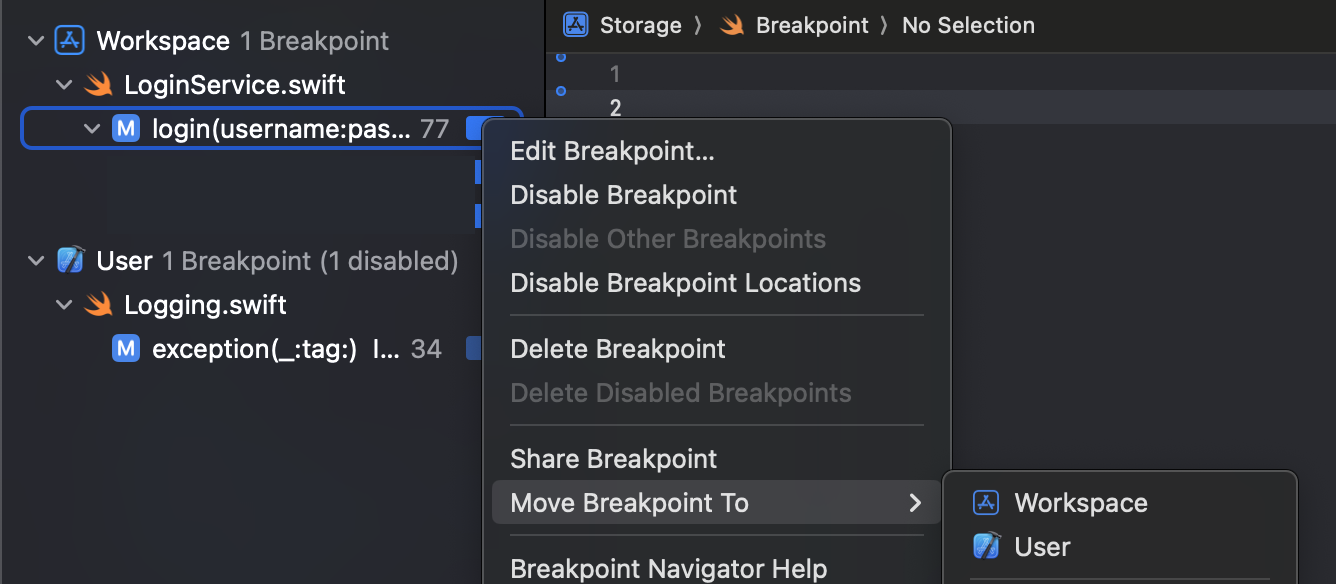
But sometimes there are breakpoints that must persist – they might be doing some setup or logging information like feature flags. Or speaking out the exceptions! To save some breakpoints we only need to move them to a separate breakpoints area. E.g. User as shown below
Instead of a summary
Logs are cool. Breakpoints are clever. Together they are.. both clever and cool. They can offer a lot of flexibility. Not only pausing the execution for stack trace analysis, but they are also capable of things like logging and modifying values. We can go as far as replacing the injected services via stubs. Or creating talking breakpoints on colleague's laptop if they left the device unlocked. It's only important to remember that breakpoints are not shared and are rather transient. And we can leverage it to enhance our debugging capabilities and speed.